中国不同干湿区植被变化及其与气候因子的关系
摘要: 中国各区植被覆盖和气候特征多样,植被覆盖变化和气候变化及植被对气候因子的响应存在明显的区域差异,研究不同气候区植被变化及其与气候变化的关系可以为各区针对性地应对气候变化、制定植物保护和生态环境修复政策提供科学依据。本文首先基于中分辨率成像光谱仪(MODIS)的土地覆盖数据,根据植被带的分布确定了划分中国干湿区的指标,其次利用归一化植被指数(NDVI)分析不同干湿区域NDVI的时空变化特征,最后探讨了NDVI变化与温度、降水的关系。结果表明:(1)中国区域200 mm、500 mm和800 mm年降水量等值线分别与荒漠/草地、草地/农田、农田(草地)/森林植被带的分界线吻合,气候过渡带对应着植被过渡带,这些等值线作为划分干湿气候区的指标比较合理。(2)中国年平均NDVI从东南向西北递减,从小到大依次为干旱区(0.11)、半干旱区(0.35)、半湿润区(0.57)、湿润区(0.68)。1982~2015年中国大部分区域NDVI呈显著的增加趋势,区域平均的NDVI在干旱区、半干旱区分别以0.002 (10 a)−1、0.008 (10 a)−1的趋势显著增加,在半湿润区和湿润区也呈现增加趋势,但不显著。(3)四个干湿区的年平均温度和NDVI均呈显著正相关,仅干旱区、半干旱区年降水和NDVI呈显著正相关,半湿润区和湿润区的年降水与NDVI呈微弱负相关。决定系数表明气候因子变化对NDVI变异的解释比例,温度对四个干湿区NDVI时间变化的解释率相差不大,均在30%左右;降水对NDVI时间变化的解释率低于温度,降水对干旱区(18%)和半干旱区(20%)NDVI时间变化的解释率较大,降水主要影响着北方地区植被的生长。(4)月平均NDVI随着温度和降水的增加都有显著的增加趋势,半湿润区的NDVI随温度升高增长的速率(0.026/°C)最快,半干旱区的NDVI对降水最敏感,随降水增多增加的速率为0.027/mm。
Abstract: Various regions in China have diverse vegetation covers and climate characteristics, and there are obvious regional differences in vegetation cover change, climate change, and the response of vegetation to climate factors. The study of vegetation changes and their relationship with climate change in different climate regions can provide a scientific basis for responding to climate change and formulating plant protection and ecological environment restoration policies in various regions. First, based on the land cover data of MODIS (MODerate-resolution Imaging Spectroradiometer), the indexes for dividing dry and wet areas in China were determined according to the regions’ vegetation zone distribution. Second, the temporal and spatial variation characteristics of the Normalized Difference Vegetation Index (NDVI) in different dry and wet areas were examined using vegetation index NDVI. Finally, the relation between the NDVI and temperature/precipitation was discussed. The findings revealed that (1) 200 mm, 500 mm, and 800 mm annual precipitation contours in China are consistent with the boundaries of the vegetation zones of barren land and grassland, grassland and cropland, and grassland/cropland and forest, respectively. The climate transition zones correspond to the vegetation transition zones. These lines are reasonable indexes corresponding to dry/wet climate zoning. (2) Annual averaged NDVI in China decreases from southeast to northwest, from small to large, as follows: the arid area (0.11), semiarid area (0.35), semihumid area (0.57), and humid area (0.68). The NDVI increased significantly in most regions of China during 1982–2015. While regional averaged NDVI increases considerably in arid and semiarid areas with trends of 0.002 (10 a)−1 and 0.008 (10 a)−1, respectively, it does not show a substantial increase in semihumid and humid areas. (3) There are significant positive correlations between the annual averaged temperature and NDVI in the four dry and wet areas. The annual precipitation is significantly correlated to NDVI only in arid and semiarid areas, and weak negative correlations are observed in semihumid and humid areas. The coefficients of determination indicate the explanation proportion of changes in climate factors to NDVI variation. The temperature changes explain about 30% of the temporal changes in NDVI in these four dry and wet areas. The explanations of precipitation changes to the temporal changes in NDVI are lower than those of temperature. Changes in precipitation explains greatly to the temporal changes in NDVI in arid areas (18%) and semiarid areas (20%), and it mainly affects the vegetation growth in northern China. (4) The monthly average NDVI exhibits a considerably increasing trend with increasing temperature and precipitation. The increasing rate (0.026/°C) of NDVI in the semihumid area is the fastest with increasing temperature, while that in the semiarid area is the most sensitive to precipitation, with an increasing rate of 0.027/mm with increasing precipitation.
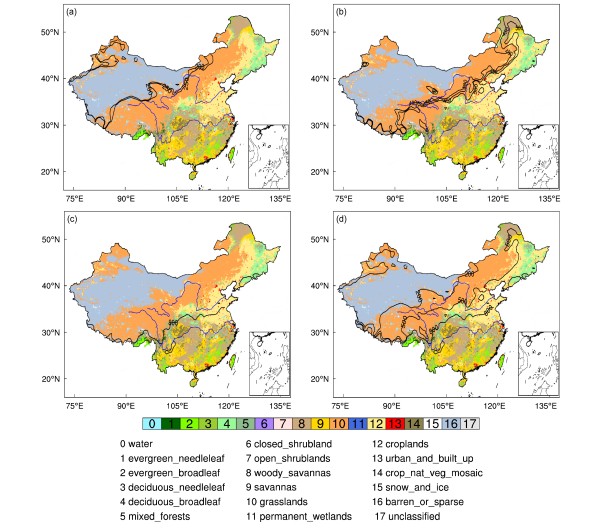
图 1 2001年中国主要土地覆盖类型空间分布(彩色阴影)和根据年降水量划分干湿气候区的不同分界线(黑色实线):(a)干旱区/半干旱区的分界线:200 mm或250 mm;(b)半干旱区/半湿润区的分界线:400 mm或450 mm或500 mm;(c)半湿润区/湿润区的分界限:800 mm;(d)四个气候区最合理的分界线:200 mm、500 mm、800 mm。
Figure 1. Spatial distribution of major land cover types (color shadings) in China in 2001 and different dry and wet climate zoning boundaries (black lines) based on annual precipitation: (a) Arid/semiarid regions are divided by 200 mm or 250 mm; (b) semiarid/semihumid regions are divided by 400 mm, or 450 mm, or 500 mm; (c) semihumid/humid regions are divided by 800 mm; (d) the most reasonable dividing lines of the four climatic zones: 200 mm, 500 mm, and 800 mm.
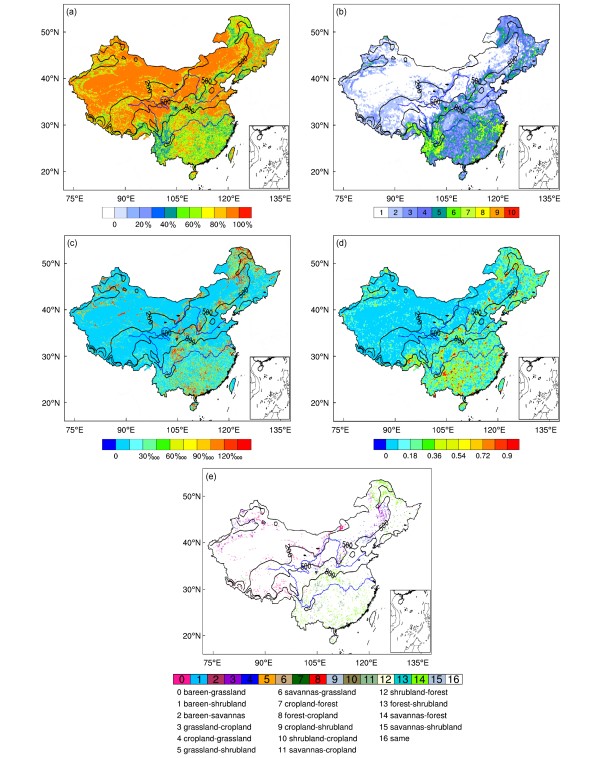
图 2 2001~2015年(a)主要土地覆盖类型所占比例的均值、(b)土地覆盖类型数目的均值、(c)主要土地覆盖类型所占比例的方差、(d)土地覆盖类型数目的方差,以及(e)2015年相对于2001年土地覆盖类型变化的空间分布。
Figure 2. Spatial distribution of (a) the average of the proportion of major land cover types, (b) the average of the numbers of land cover types, (c) the variance of the proportion of major land cover types, (d) the variance of the numbers of land cover types during 2001–2015, and (e) the land cover type changes in 2015 relatively to 2001.
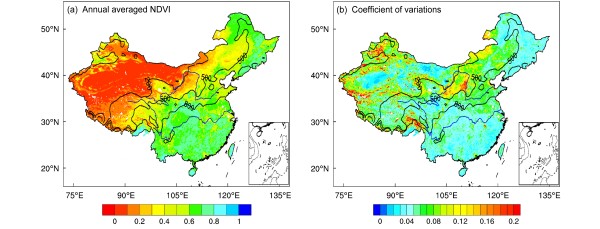
图 3 1982~2015年NDVI(a)均值和(b)离散系数的空间分布。
Figure 3. Spatial distribution of (a) annual averaged NDVI (Normalized Difference Vegetation Index) and (b) NDVI coefficient of variances in 1982–2015.
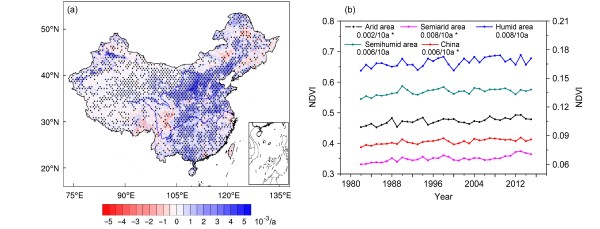
图 4 1982~2015年(a)NDVI变化趋势的空间分布,(b)不同干湿区NDVI的时间序列。图a中,黑色圆点表示通过了95%置信水平的显著性检验。图b中,右侧纵坐标:干旱区;左侧纵坐标:其他区域。
Figure 4. (a) Spatial distribution of the change trends of NDVI and (b) time series of NDVI in different dry and wet areas during 1982–2015. In Fig. a, the black dots indicate statistical significance at the 95% confidence level. In Fig. b, the right y-axis: the arid area; the left y-axis: the others.
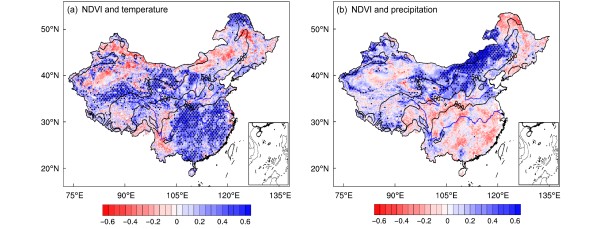
图 5 1982~2015年NDVI与(a)温度、(b)降水量相关系数的空间分布。黑色圆点表示通过了95%置信水平的显著性检验。
Figure 5. Spatial distributions of correlation coefficients between NDVI and (a) temperature, (b) precipitation in 1982–2015. Black dots indicate statistical significance at the 95% confidence level.
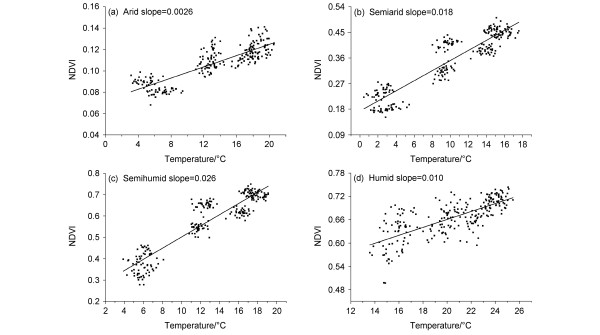
图 6 1982~2015年(a)干旱区、(b)半干旱区、(c)半湿润区、(d)湿润区的月平均NDVI和月平均温度散点分布。
Figure 6. Scatter distributions of monthly averaged NDVI and monthly averaged temperature in the (a) arid, (a) semiarid, (a) semihumid, and (d) humid areas during 1982–2015.
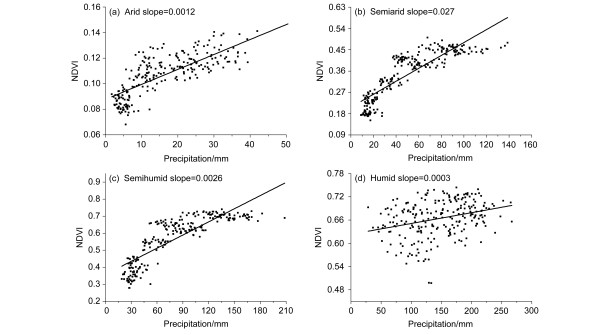
图 7 1982~2015年(a)干旱区、(b)半干旱区、(c)半湿润区、(d)湿润区的月平均NDVI和月降水量散点分布。
Figure 7. Scatter distributions of monthly averaged NDVI and monthly precipitation in the (a) arid, (a) semiarid, (a) semihumid, and (d) humid areas during 1982–2015.
表 1 1982~2015年四个干湿区NDVI、温度和降水量的变化趋势
Table 1 The trends of NDVI, temperature, and precipitation in the four dry and wet areas during 1982–2015
变化趋势NDVI/(10 a)−1温度/°C (10 a)−1降水量/mm (10 a)−1 干旱区0.002*0.46*7.2半干旱区0.008*0.42*3.8半湿润区0.0060.33*−4.2湿润区0.0080.29*−6.7 注:*表示通过了95%置信水平的显著性检验,下同。表 2 1982~2015年四个干湿区区域平均NDVI与温度、降水量的相关系数和决定系数
Table 2 Correlation coefficients and determination coefficients between regional averaged NDVI and temperature, precipitaion in the four dry and wet areas in 1982–2015
NDVI与温度 NDVI与降水量 相关系数R 决定系数R2 相关系数R 决定系数R2 干旱区 0.61* 0.37 0.42* 0.18 半干旱区 0.61* 0.37 0.45* 0.20 半湿润区 0.54* 0.29 −0.06 0.004 湿润区 0.56* 0.31 −0.19 0.04表 3 1999~2015年与1982~1998年相比,四个干湿区温度、降水量、NDVI的变化和各因素对NDVI变化的贡献率
Table 3 Compared 1999–2015 with 1982–1998, the changes in temperature, precipitation, NDVI, and the contributions of various factors to NDVI changes in the four dry and wet areas
ΔT/°CΔP/mmΔNDVITΔNDVIPΔNDVICTCPCQ 干旱区15.09191.970.0480.0130.05882.76%22.41%−5.17%半干旱区13.46−68.250.153−0.0100.16592.73%−6.06%13.33%半湿润区9.98−230.340.1320.0040.122108.20%3.28%−11.48%湿润区8.65−152.390.1820.0050.19394.30%2.59%3.11% 注:ΔT、ΔP分别表示温度、降水量的总变化量;ΔNDVIT、ΔNDVIP分别表示由于温度、降水量的变化引起NDVI的变化量;ΔNDVI表示实际NDVI的变化量;CT、CP、CQ分别表示温度、降水量和除温度、降水量外的其他因素对NDVI变化的贡献率。Ali M. 2013. Effects of climate change on vegetation [M]//Ali M. Climate Change Impacts on Plant Biomass Growth. Dordrecht: Springer, 29–49.
Bachelet D, Neilson R P, Lenihan J M, et al. 2001. Climate change effects on vegetation distribution and carbon budget in the United States [J]. Ecosystems, 4(3): 164−185. doi: 10.1007/s10021-001-0002-7
陈伏龙, 冯平, 吴泽斌. 2017. 三工河流域平原区蒸发量变化特征及影响因素 [J]. 干旱区地理, 40(1): 45−53. doi: 10.13826/j.cnki.cn65-1103/x.2017.01.006Chen Fulong, Feng Ping, Wu Zebin. 2017. Changes of evaporation and impact factors in the plain region in Sangong River basin [J]. Arid Land Geogr. (in Chinese), 40(1): 45−53. doi: 10.13826/j.cnki.cn65-1103/x.2017.01.006
陈海, 康慕谊, 范一大. 2004. 北方农牧交错带植被覆盖的动态变化及其与气候因子关系 [J]. 地理与地理信息科学, 20(5): 54−57. doi: 10.3969/j.issn.1672-0504.2004.05.013Chen Hai, Kang Muyi, Fan Yida. 2004. Relationship between dynamic change of vegetation cover and climate factors in farming-pastoral zone of North China [J]. Geogr. Geo-Inf. Sci. (in Chinese), 20(5): 54−57. doi: 10.3969/j.issn.1672-0504.2004.05.013
陈明荣. 1974. 对于干湿气候区划指标问题的探讨 [J]. 西北大学学报(自然科学版), (2): 111–119.Chen Mingrong. 1974. Discussion on the indexes of dry and wet climate zoning [J]. J. Northwest Univ. Natl. Sci. Ed.) (in Chinese), (2): 111–119.
慈龙骏, 吴波. 1997. 中国荒漠化气候类型划分与潜在发生范围的确定 [J]. 中国沙漠, 17(2): 107−111.Ci Longjun, Wu Bo. 1997. Climate type division and the potential extent determination of desertification in China [J]. J. Desert Res. (in Chinese), 17(2): 107−111.
韩云环, 马柱国, 李明星, 等. 2021. 2001~2010年中国区域土地利用/覆盖变化对陆面过程影响的模拟研究 [J]. 气候与环境研究, 26(1): 75−90. doi: 10.3878/j.issn.1006-9585.2020.20039Han Yunhuan, Ma Zhuguo, Li Mingxing, et al. 2021. Numerical simulation of the impact of land use/cover change on land surface process in China from 2001 to 2010 [J]. Climatic Environ. Res. (in Chinese), 26(1): 75−90. doi: 10.3878/j.issn.1006-9585.2020.20039
Hou W J, Gao J B, Wu S H, et al. 2015. Interannual variations in growing-season NDVI and its correlation with climate variables in the southwestern Karst region of China [J]. Remote Sens., 7(9): 11105−11124. doi: 10.3390/rs70911105
Hu M Q, Mao F, Sun H, et al. 2011. Study of normalized difference vegetation index variation and its correlation with climate factors in the three-river-source region [J]. Int. J. Appl. Earth Observat. Geoinformat., 13(1): 24−33. doi: 10.1016/j.jag.2010.06.003
Kelly A E, Goulden M L. 2008. Rapid shifts in plant distribution with recent climate change [J]. Proc. Natl. Acad. Sci. USA, 105(33): 11823−11826. doi: 10.1073/pnas.0802891105
Lawley V, Lewis M, Clarke K, et al. 2016. Site-based and remote sensing methods for monitoring indicators of vegetation condition: An Australian review [J]. Ecol. Indicat., 60: 1273−1283. doi: 10.1016/j.ecolind.2015.03.021
Li D L, Wu S Y, Liu L B, et al. 2018. Vulnerability of the global terrestrial ecosystems to climate change [J]. Global Change Biol., 24(9): 4095−4106. doi: 10.1111/gcb.14327
李晶, 刘乾龙, 刘鹏宇. 2022. 1998~2018年呼伦贝尔市植被覆盖度时空变化及驱动力分析 [J]. 生态学报, 42(1): 220−235. doi: 10.5846/stxb202003270710Li Jing, Liu Qianlong, Liu Pengyu. 2022. Spatio-temporal changes and driving forces of fraction of vegetation coverage in Hulunbuir (1998–2018) [J]. Acta Ecol. Sinica (in Chinese), 42(1): 220−235. doi: 10.5846/stxb202003270710
李秀, 郎琪, 雷坤, 等. 2021. 1958~2018年永定河流域蒸发皿蒸发量的变化特征及其影响因子分析 [J]. 气候与环境研究, 26(3): 323−332. doi: 10.3878/j.issn.1006-9585.2020.20108Li Xiu, Lang Qi, Lei Kun, et al. 2021. Variation characteristics of pan evaporation and the influencing factors in the Yongding River basin during 1958–2018 [J]. Climatic Environ. Res. (in Chinese), 26(3): 323−332. doi: 10.3878/j.issn.1006-9585.2020.20108
Linscheid N, Estupinan-Suarez L M, Brenning A, et al. 2020. Towards a global understanding of vegetation–climate dynamics at multiple timescales [J]. Biogeosciences, 17(4): 945−962. doi: 10.5194/bg-17-945-2020
刘波, 马柱国. 2007. 过去45年中国干湿气候区域变化特征 [J]. 干旱区地理, 30(1): 7−15. doi: 10.3321/j.issn:1000-6060.2007.01.002Liu Bo, Ma Zhuguo. 2007. Area change of dry and wet regions in China in the past 45 years [J]. Arid Land Geogr. (in Chinese), 30(1): 7−15. doi: 10.3321/j.issn:1000-6060.2007.01.002
刘珞丹, 李晶, 柳彩霞, 等. 2021. 2000~2015年长江经济带植被覆盖时空变化特征及影响因素分析 [J]. 水土保持研究, 28(6): 330−336, 347. doi: 10.13869/j.cnki.rswc.2021.06.026Liu Luodan, Li Jing, Liu Caixia, et al. 2021. Analysis on the characteristics of temporal and spatial changes and influencing factors of vegetation coverage in the Yangtze River Economic Belt from 2000 to 2015 [J]. Res. Soil Water Conservat. (in Chinese), 28(6): 330−336,347. doi: 10.13869/j.cnki.rswc.2021.06.026
毛德华, 王宗明, 宋开山, 等. 2011. 东北多年冻土区植被NDVI变化及其对气候变化和土地覆被变化的响应 [J]. 中国环境科学, 31(2): 283−292.Mao Dehua, Wang Zongming, Song Kaishan, et al. 2011. The vegetation NDVI variation and its responses to climate change and LUCC from 1982 to 2006 year in northeast permafrost region [J]. China Environ. Sci. (in Chinese), 31(2): 283−292.
Nemani R R, Keeling C D, Hashimoto H, et al. 2003. Climate-driven increases in global terrestrial net primary production from 1982 to 1999 [J]. Science, 300(5625): 1560−1563. doi: 10.1126/science.1082750
Pettorelli N, Vik J O, Mysterud A, et al. 2005. Using the satellite-derived NDVI to assess ecological responses to environmental change [J]. Trends Ecol. Evolut., 20(9): 503−510. doi: 10.1016/j.tree.2005.05.011
Seddon A W R, Macias-Fauria M, Long P R, et al. 2016. Sensitivity of global terrestrial ecosystems to climate variability [J]. Nature, 531(7593): 229−232. doi: 10.1038/nature16986
Stephenson N L. 1990. Climatic control of vegetation distribution: The role of the water balance [J]. Amer. Naturalist, 135(5): 649−670. doi: 10.1086/285067
孙红雨, 王长耀, 牛铮, 等. 1998. 中国地表植被覆盖变化及其与气候因子关系——基于NOAA时间序列数据分析 [J]. 遥感学报, 2(3): 204−210. doi: 10.11834/jrs.19980309Sun Hongyu, Wang Changyao, Niu Zheng, et al. 1998. Analysis of the vegetation cover change and the relationship between NDVI and environmental factors by using NOAA time series data [J]. J. Remote Sens. (in Chinese), 2(3): 204−210. doi: 10.11834/jrs.19980309
Thornthwaite C W. 1948. An approach toward a rational classification of climate [J]. Geograph. Rev., 38(1): 55−94. doi: 10.2307/210739
王延禄. 1990. 我国建立、引用和验证气象干旱指标综述 [J]. 干旱区地理, 13(3): 80−86. doi: 10.13826/j.cnki.cn65-1103/x.1990.03.017Wang Yanlu. 1990. The summary concerning arid meteorological targets to establish, quote and test in China [J]. Arid Land Geogr. (in Chinese), 13(3): 80−86. doi: 10.13826/j.cnki.cn65-1103/x.1990.03.017
王雨晴, 张成福, 李晓鸿. 2020. 内蒙古典型草原区NDVI对气候变化的响应 [J]. 水土保持研究, 27(4): 201−205. doi: 10.13869/j.cnki.rswc.2020.04.026Wang Yuqing, Zhang Chengfu, Li Xiaohong. 2020. Response of NDVI to climate change in typical steppes of Inner Mongolia [J]. Res. Soil Water Conservat. (in Chinese), 27(4): 201−205. doi: 10.13869/j.cnki.rswc.2020.04.026
温刚, 符淙斌. 2000. 利用卫星遥感数据集确定气候过渡带和植被过渡带 [J]. 大气科学, 24(3): 324−332. doi: 10.3878/j.issn.1006-9895.2000.03.04Wen Gang, Fu Congbin. 2000. Defination of climate and ecological transitional zones with satellite data sets [J]. Chinese Journal of Atmospheric Sciences (in Chinese), 24(3): 324−332. doi: 10.3878/j.issn.1006-9895.2000.03.04
Wu C Y, Wang X Y, Wang H J, et al. 2018. Contrasting responses of autumn-leaf senescence to daytime and night-time warming [J]. Nat. Climate Change, 8(12): 1092−1096. doi: 10.1038/s41558-018-0346-z
谢力, 温刚, 符淙斌. 2002. 中国植被覆盖季节变化和空间分布对气候的响应——多年平均结果 [J]. 气象学报, 60(2): 181–187.Xie Li, Wen Gang, Fu Congbin. 2002. The response of the vegetation seasonal variability and its spatial pattern to climate variation in China: Multi-year average. Acta Meteor. Sinica (in Chinese), 60(2): 181–187. doi: 10.11676/qxxb2002.022.
徐勇, 黄雯婷, 靖娟利, 等. 2020. 京津冀地区植被NDVI动态变化及其与气候因子的关系 [J]. 水土保持通报, 40(5): 319−327. doi: 10.13961/j.cnki.stbctb.2020.05.045Xu Yong, Huang Wenting, Jing Juanli, et al. 2020. Dynamic variation of vegetation cover and its relation with climate variables in Beijing–Tianjin–Hebei region [J]. Bull. Soil Water Conservat. (in Chinese), 40(5): 319−327. doi: 10.13961/j.cnki.stbctb.2020.05.045
杨建平, 丁永建, 陈仁升, 等. 2002. 近50年来中国干湿气候界线的10年际波动 [J]. 地理学报, 57(6): 655−661. doi: 10.3321/j.issn:0375-5444.2002.06.004Yang Jianping, Ding Yongjian, Chen Rensheng, et al. 2002. The interdecadal fluctuation of dry and wet climate boundaries in China in recent 50 Years [J]. Acta Geograph. Sinica (in Chinese), 57(6): 655−661. doi: 10.3321/j.issn:0375-5444.2002.06.004
於琍, 李克让, 陶波, 等. 2010. 植被地理分布对气候变化的适应性研究 [J]. 地理科学进展, 29(11): 1326−1332. doi: 10.11820/dlkxjz.2010.11.012Yu Li, Li Kerang, Tao Bo, et al. 2010. Simulating and assessing the adaptability of geographic distribution of vegetation to climate change in China [J]. Progr. Geogr. (in Chinese), 29(11): 1326−1332. doi: 10.11820/dlkxjz.2010.11.012
张存杰, 廖要明, 段居琦, 等. 2016. 我国干湿气候区划研究进展 [J]. 气候变化研究进展, 12(4): 261−267. doi: 10.12006/j.issn.1673-1719.2015.191Zhang Cunjie, Liao Yaoming, Duan Juqi, et al. 2016. The progresses of dry–wet climate divisional research in China [J]. Climate Change Res. (in Chinese), 12(4): 261−267. doi: 10.12006/j.issn.1673-1719.2015.191
Zhang D, Geng X L, Chen W X, et al. 2021. Inconsistency of global vegetation dynamics driven by climate change: Evidences from spatial regression [J]. Remote Sens., 13(17): 3442. doi: 10.3390/rs13173442
赵倩倩, 张京朋, 赵天保, 等. 2021. 2000年以来中国区域植被变化及其对气候变化的响应 [J]. 高原气象, 40(2): 292−301. doi: 10.7522/j.issn.1000-0534.2020.00025Zhao Qianqian, Zhang Jingpeng, Zhao Tianbao, et al. 2021. Vegetation changes and its response to climate change in China since 2000 [J]. Plateau Meteor. (in Chinese), 40(2): 292−301. doi: 10.7522/j.issn.1000-0534.2020.00025
郑有飞, 牛鲁燕, 吴荣军, 等. 2009. 1982~2003年贵州省植被覆盖变化及其对气候变化的响应 [J]. 生态学杂志, 28(9): 1773−1778.Zheng Youfei, Niu Luyan, Wu Rongjun, et al. 2009. Vegetation cover change in Guizhou of Southwest China in 1982–2003 in response to climate change [J]. Chinese J. Ecol. (in Chinese), 28(9): 1773−1778.
周广胜, 张新时. 1996a. 全球变化的中国气候—植被分类研究 [J]. 植物学报, 38(1): 8−17.Zhou Guangsheng, Zhang Xinshi. 1996a. Study on climate vegetation classification for global change in China [J]. Acta Botan. Sinica (in Chinese), 38(1): 8−17.
周广胜, 张新时. 1996b. 中国气候—植被关系初探 [J]. 植物生态学报, 20(2): 113−119.Zhou Guangsheng, Zhang Xinshi. 1996b. Study on Chinese climate–vegetation relationship [J]. Acta Phytoecol. Sinica (in Chinese), 20(2): 113−119.
网址:中国不同干湿区植被变化及其与气候因子的关系 https://m.mxgxt.com/news/view/1626257
相关内容
土壤湿度在气候变化研究中的独特作用半干旱草原温室气体排放/吸收与环境因子的关系研究
地表土壤湿度和植被状况的监测及其与沙尘暴发生的关系探讨
降水与土壤湿度因果关系分析及预测研究
土壤湿度与蒸散的关系及模拟研究
中国干湿区分布图
气候变化与消失的海绵有什么关系?
植被条件对下垫面空气动力学粗糙度影响实验研究
寸土之地倍加珍惜:澳门的湿地保育和候鸟迁徙
哈尼族与普洱茶:关系、区别、品质及价格全解析
随便看看
最新实时动态
- 为什么抚摸婴儿背部会让其不再哭闹
- 张凌赫又争又抢,田曦薇逐玉家属感引热议
- 专家解读台风“巴威”“隔空致雨”成因
- 周星驰坦言惭愧
- 我没有想赢,我只是不想输,看到结局直接泪目了
- 哈妮克孜 娱乐评论大赏
- 张凌赫你说实话是不是私下里一直刷小田视频
- 你追逐热爱我追逐你,肖战粉丝告白温暖治愈
- 郝熠然舞台绽放活力,迎光开启新一天
- 扎堆出现的“伪骨科”,救得了现偶市场吗?
热点实时动态
- 120890
- 25444
- 20040
- 19724
- 19484
- 19440
- 19175
- 18746
- 18710
- 18695